motivation
I’am using OpenWrt for a long time and monitoring of them was always a little bit tricky. It’s getting more complex if you’re going to use more access points. It’s an no brainer since the prometheus-node-exporter scripts exist.
openwrt setup
install scripts
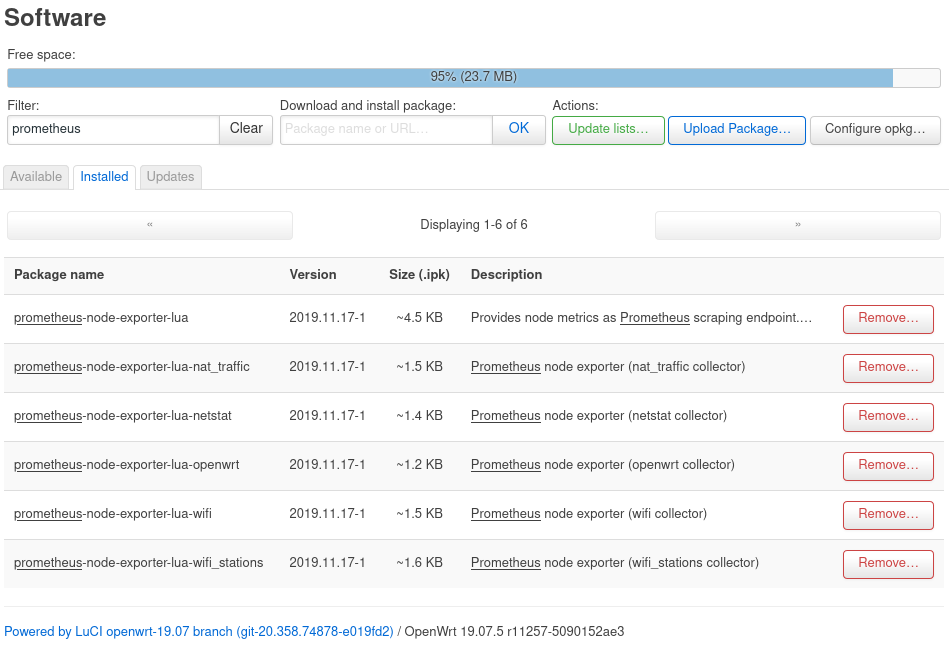
You should start with an up to date OpenWrt router. Install the prometheus node exporter scripts:
- prometheus-node-exporter-lua
- prometheus-node-exporter-lua-nat_traffic
- prometheus-node-exporter-lua-netstat
- prometheus-node-exporter-lua-openwrt
- prometheus-node-exporter-lua-wifi
- prometheus-node-exporter-lua-wifi_stations
change listening interface
If you use the default config, the node exporter can only be queried from the loopback interface.
root@OpenWrt:/etc/config# cat prometheus-node-exporter-lua
config prometheus-node-exporter-lua 'main'
	option listen_interface 'loopback'
	option listen_ipv6 '0'
	option listen_port '9100'
For my setup i’ll change it to the lan network interface:
root@OpenWrt:/etc/config# sed -i.bak 's#loopback#lan#g' /etc/config/prometheus-node-exporter-lua
& restart the exporter
root@OpenWrt:/etc/config# /etc/init.d/prometheus-node-exporter-lua restart
(optional) check
- running exporter interface
root@OpenWrt:/etc/config# netstat -tulpn | grep 9100
tcp        0      0 YOUR_ROUTER_IP:9100        0.0.0.0:*               LISTEN      3469/lua
- running exporter config
root@OpenWrt:/etc/config# ps | grep prometheus
 3469 root      1920 S    {prometheus-node} /usr/bin/lua /usr/bin/prometheus-node-exporter-lua --bind YOUR_ROUTER_IP --port 9100
- open port from host in lan
[user@HOST-IN-LAN ~]$ nmap YOUR_ROUTER_IP -p 9100
9100/tcp open  jetdirect
- metrics from host in lan
[user@HOST-IN-LAN ~]$ curl YOUR_ROUTER_IP:9100/metrics
& you should see a lot of metrics here …
(optional) prometheus setup
You’re now ready to setup up Prometheus. If you already have an instance, you just need to add the scrape_config . If you haven’t one, no problem =>
startup new instance
If your’re familiar with docker & compose you can simply start up new prometheus/grafana instances. Use this config only for temporary usage:
version: '2.1'

networks:
  monitor-net:
    driver: bridge

volumes:
    prometheus_data: {}
    grafana_data: {}

services:

  prometheus:
    image: prom/prometheus:v2.23.0
    container_name: prometheus
    volumes:
      - ./prometheus:/etc/prometheus
      - prometheus_data:/prometheus
    command:
      - '--config.file=/etc/prometheus/prometheus.yml'
      - '--storage.tsdb.path=/prometheus'
      - '--web.console.libraries=/etc/prometheus/console_libraries'
      - '--web.console.templates=/etc/prometheus/consoles'
      - '--storage.tsdb.retention.time=200h'
      - '--web.enable-lifecycle'
    restart: unless-stopped
    expose:
      - 9090
    ports:
      - 9090:9090
    networks:
      - monitor-net
    labels:
      org.label-schema.group: "monitoring"

  grafana:
    image: grafana/grafana:7.3.6
    container_name: grafana
    volumes:
      - grafana_data:/var/lib/grafana
      - ./grafana/provisioning:/etc/grafana/provisioning
    environment:
      - GF_SECURITY_ADMIN_USER=${ADMIN_USER:-admin}
      - GF_SECURITY_ADMIN_PASSWORD=${ADMIN_PASSWORD:-admin}
      - GF_USERS_ALLOW_SIGN_UP=false
    restart: unless-stopped
    expose:
      - 3000
    ports:
      - 3000:3000
    networks:
      - monitor-net
    labels:
      org.label-schema.group: "monitoring"
This is an trimmed down & modified version from stefanprodan
prometheus config
Before you spin up prometheus you have to change/add the config. Replace YOUR_ROUTER_IP:
[user@HOST-IN-LAN ~]$ vi prometheus/prometheus.yml
global:
  scrape_interval:     15s
  evaluation_interval: 15s

  # Attach these labels to any time series or alerts when communicating with
  # external systems (federation, remote storage, Alertmanager).
  external_labels:
      monitor: 'docker-host-alpha'

# Load and evaluate rules in this file every 'evaluation_interval' seconds.
rule_files:
  - "alert.rules"

# A scrape configuration containing exactly one endpoint to scrape.
scrape_configs:
  - job_name: 'openwrt-router1'
    scrape_interval: 5s
    static_configs:
      - targets: ['YOUR_ROUTER_IP:9100']
Your directory structure should be similar like this:
[user@HOST-IN-LAN dockprom]$ tree
.
├── docker-compose.yml
├── grafana
│   └── provisioning
└── prometheus
    └── prometheus.yml
start containers
Now start the docker containers in detached mode:
[user@HOST-IN-LAN dockprom]$ docker-compose up -d
After the images was pulled they should be started after a few seconds
[user@HOST-IN-LAN dockprom]$ docker ps -a
CONTAINER ID        IMAGE                       COMMAND                  CREATED             STATUS                       PORTS                    NAMES
ea8419f267e5        prom/prometheus:v2.23.0     "/bin/prometheus --c…"   3 hours ago         Up 3 hours                   0.0.0.0:9090->9090/tcp   prometheus
f17822ba6bcf        grafana/grafana:7.3.6       "/run.sh"                3 hours ago         Up 3 hours                   0.0.0.0:3000->3000/tcp   grafana
Open the grafana dashboard in your browser => http://localhost:3000. The default credentials are admin / admin. You’re prompted to change it.
configure grafana
add prometheus datasource
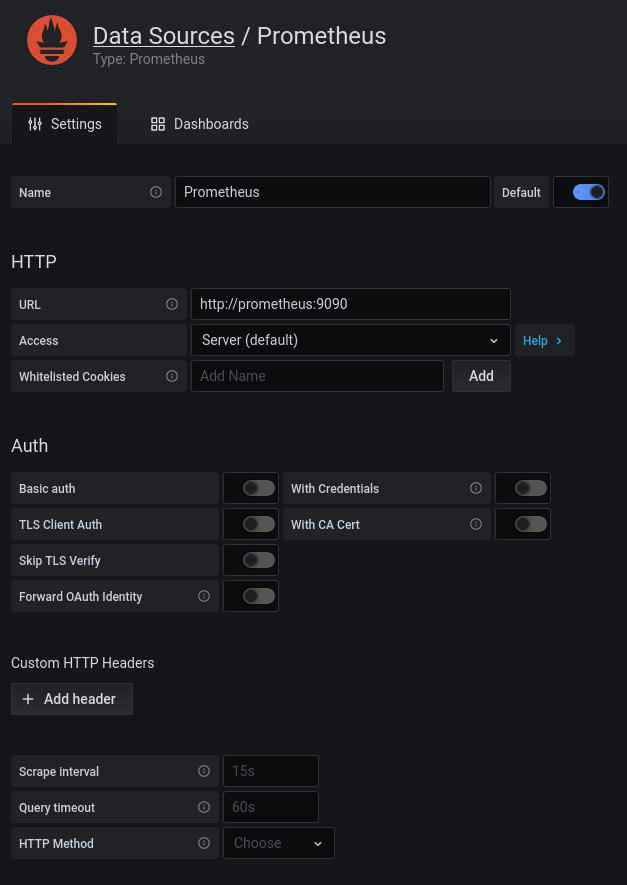
Now add the new Prometheus instance as datasource to grafana. Go to Configuration/Datasources, select the prometheus datasource & configure the URL. We can use the docker container name here because we are in the same docker network. If your run another setup, add here the ip of your main Prometheus server:
add OpenWrt dashboard
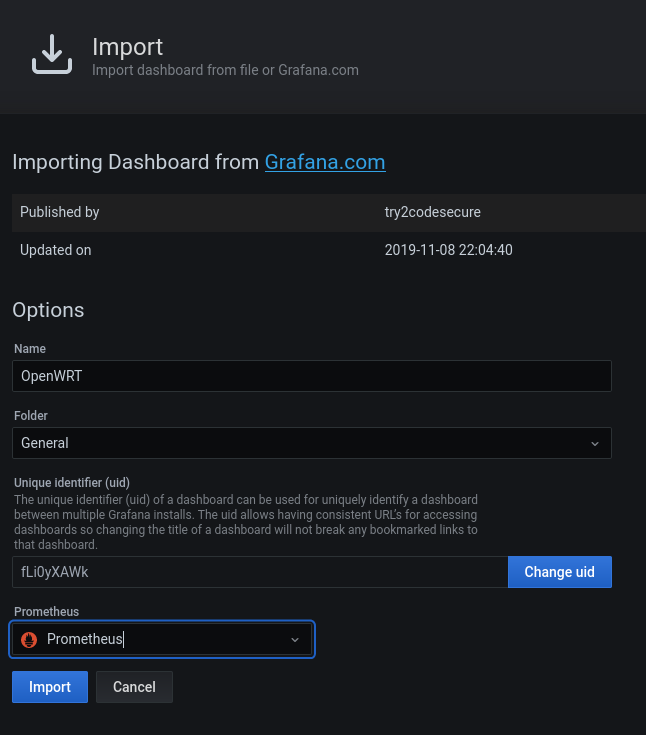
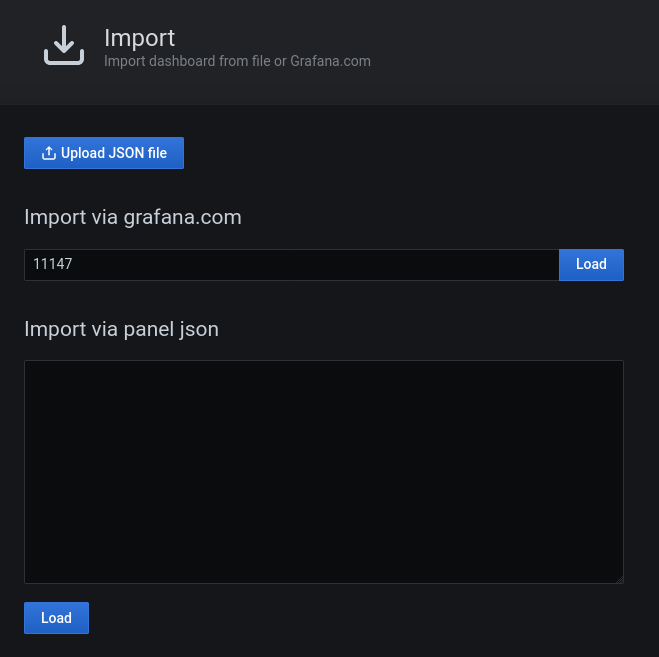
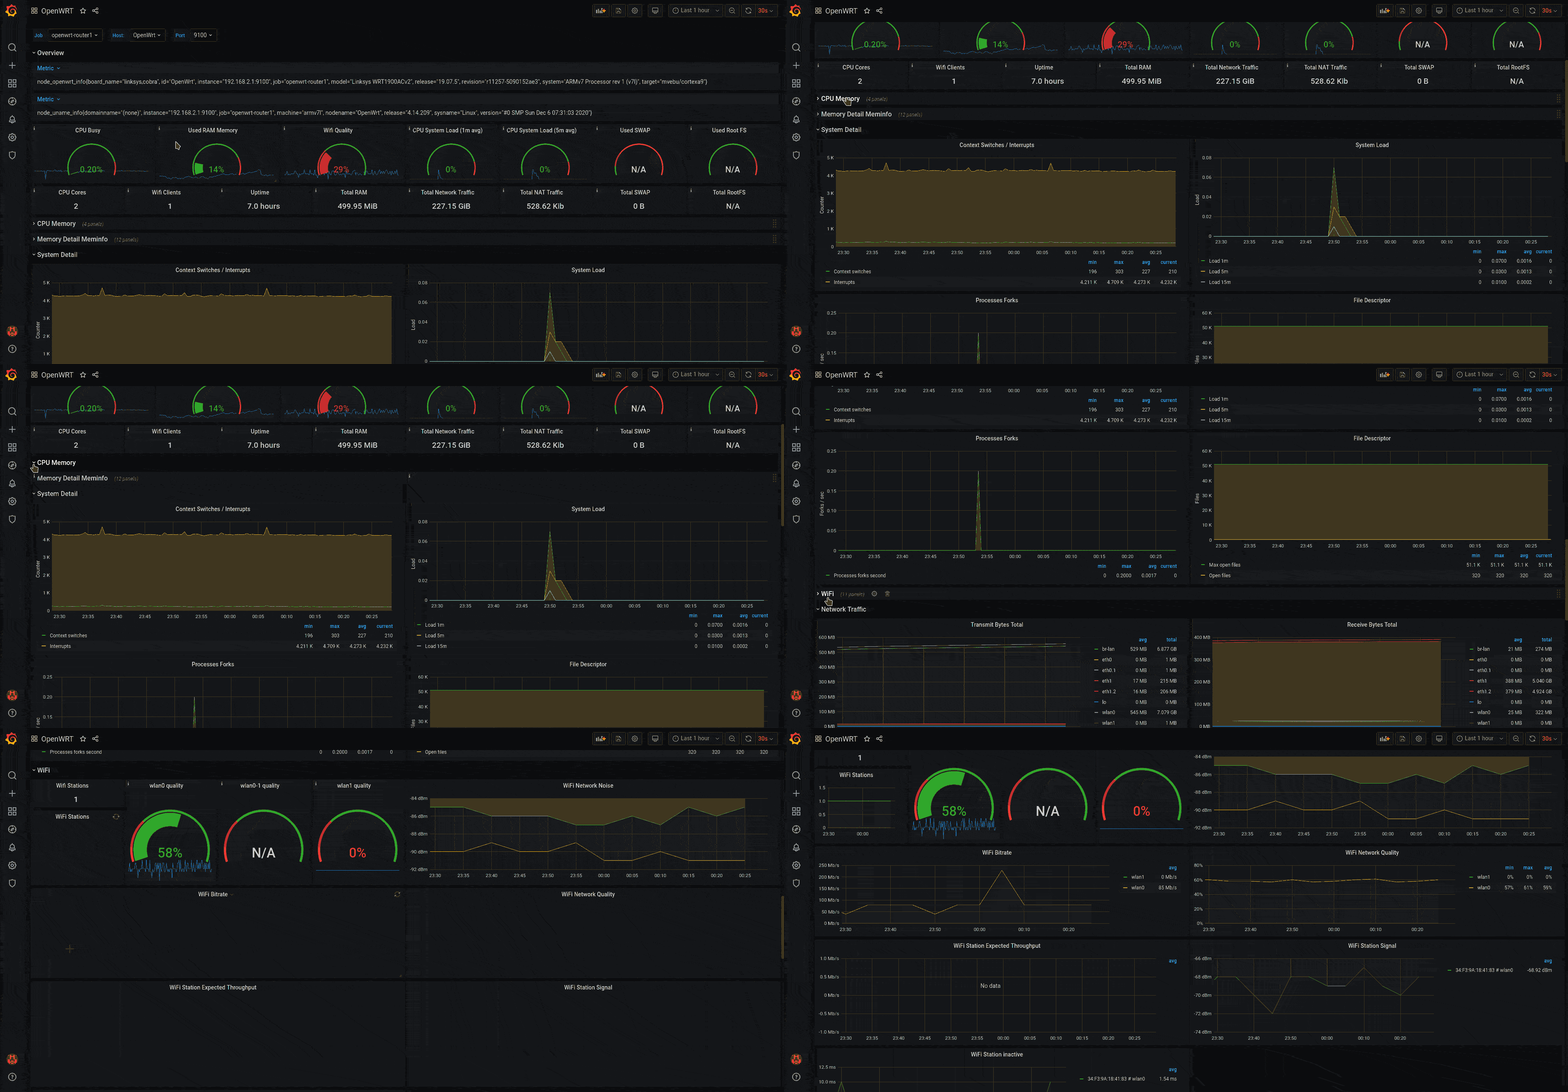
Now you can import the dashboard. You can use my Grafana dashboard for OpenWrt (11147).
Select the newly created Prometheus datasource.
